
Table of Contents
Download Free infographic templates. Easy to use for making infographics for your business or presentations.
Learn the ins and outs of making infographics, from what they are and the different types available to how to best market your own creation. You can create infographic templates and make money selling them or create infographics for your own business from scratch.
Did you know that visuals are retained at a rate of 65% while auditory ones are retained at only 10%?
In addition, when instructions are presented in both written and visual forms, people are 323% more likely to complete the task at hand.
This is why it’s crucial for marketers to present data visually and verbally in a way that’s straightforward for their target audience.
Infographics are a fantastic tool for making this happen.
You’ve found the ideal site if you’ve ever considered making and sharing an infographic. Thoughts like “I’m not a graphic designer” or “I’ve never developed an infographic before” are quite understandable. Still, you should know that you have company.
And that doesn’t preclude the possibility of a simple learning curve for you.
Everything from the definition of infographics and the many types of infographics to post-creation infographic promotion is covered in this essay.
What is an infographic?
A visual representation of information or data is known as an infographic. It is a visual type of communication that uses words to convey meaning. The objective is to convey a concept visually, using charts and diagrams, with as little language as possible.
Infographics are visual depictions of data that aim to explain complex topics in a simple format.
Infographics are popular because they make it easy to convey a broad concept, break down a complicated procedure, and present lots of data at once. If you want to compare two different ideas or thoughts, an infographic is a terrific tool to use.
If you’re a marketer, you may know the sensation of uncertainty that comes from needing to produce a marketing asset for a campaign but being unsure of the most effective means of doing so. Is your thought more suited to a video on YouTube or a status update on Facebook? The good news is that infographics may be used for promotional purposes across all platforms and sectors.
Infographic Dimensions
Now that you understand the purpose of an infographic and have seen some examples, you may be wondering how to create one of your own.
Knowing the appropriate dimensions for your infographic is a necessary first step before beginning the creative process.
The response is conditional on the medium through which the promotion will take place. The suggested dimensions for the most popular locations where an infographic could be posted are as follows:
- Facebook: 1200 x 628 pixels
- Pinterest: 600 x 900 pixels
- Website/Blog: 600 x 1800 pixels
- Twitter: 1200 x 675 pixels
- Instagram: 1080 x 1080 pixels
- LinkedIn: 1104 x 736 pixels
Infographic Ideas and Topics
- Comparison Infographics
- Marketing Infographics
- Process Infographics
- Timeline Infographics
- Statistical Infographics
Comparison
Any infographic that draws parallels between two subjects can be classified as a comparison infographic. Infographics are useful for making comparisons and contrasts since the data may be displayed side by side.
See a sample infographic that draws parallels between poor and excellent posture below. You can read the copy that explains how poor posture can affect your health, mood, communication, and appearance, and you can see the difference for yourself.
Marketing
The primary goals of any marketing infographic should be to increase brand recognition and consumer participation.
The marketing infographic may be used to highlight company accomplishments, disseminate information, introduce a new product or service, enhance classroom handouts, generate buzz on social media, display statistics, provide quotes, and condense the main points of a blog post. The potential outcomes are truly limitless.
Infographics may be implemented in any area imaginable. Always think about whether or not an infographic can assist support your argument whenever you’re planning to create a marketing piece.
Process
A process infographic is a visual representation of information that breaks down and clarifies a complex procedure.
An easy-to-follow format makes it clear what happens at each stage.
Time is saved by both the creator and the recipient of a well-designed process infographic, which makes the idea you wish to convey more understandable.
An example process infographic explaining mechanical recycling is shown below.
Timeline
A timeline infographic is a means to swiftly communicate significant information – from critical dates in your company’s history to forthcoming project milestones or expected industry trends.
You might use this sort of infographic if, say, you were organising a product launch. Alternatively, you may like to include a corporate history chronology on your website.
Statistical
In order to demonstrate research and facts, a graphic with the name “infographic” is often used. Hypothetically, your organisation may own first-party data about the industry. Surely a visual representation of this data would be the most effective method of dissemination.
Now that you know the many kinds of infographics that exist, I’d like to share some advice on how to make your own.
Infographic Tips
- Find resources.
- Target your buyer personas.
- Keep it focused and simple.
- Use visuals.
Gather various resources
Seek out useful materials before attempting to make your own infographics. If you don’t have access to a graphic designer, this will come in handy.
Utilize pre-made layouts for presentations in PowerPoint or graphic design in Canva. Charts, reports, and infographics are just some of the design materials readily available today. And there’s a wide variety of possibilities to choose from, each with its own set of advantages and relatively few disadvantages, depending on your demands and your budget.
Target your buyers Preferences
You may have noticed that my comments on the examples above tended to focus on infographics that successfully communicated with their intended audience. Any promotional item that isn’t developed with the target audience in mind is doomed to fail.
Always keep in mind that marketing’s ultimate goal is to effectively communicate with target customers at the perfect moment.
keep it straightforward
Infographics are a wonderful tool for maintaining focus and conveying complex ideas in straightforward language.
The most effective communications are brief and tailored to the receiver. This is why it’s important to keep your infographics concise and easy to understand.
When possible, it is in your best interest as a marketer to use straightforward language in your communications. When communicating, keep things as straightforward as possible.
Take advantage of visuals
Visuals are essential to a successful infographic, of course. In reality, an infographic’s primary purpose is to convey information visually and verbally.
Images should captivate the audience and make the content simpler to absorb. You don’t need to have graphic design experience to achieve this, either.
You may actually simplify your work with the help of pre-made templates. See below for an explanation of the many benefits of using templates.
Infographic Templates
Infographics are a highly effective method of getting the attention of your intended readers. In fact, compared to their non-infographic publishing counterparts, firms who do produce infographics see a 12 percent increase in website traffic.
The following are various infographic templates that help transfer information much easier to the reader. The reader can get a full grasp of the subject very quickly. This is extremely helpful in marketing, teaching and even seminars. The colouring and design of the infographic also helps to keep viewers attention.
Example 1: Tech infographic template
Download this infographic template
Example 2: Business infographic template
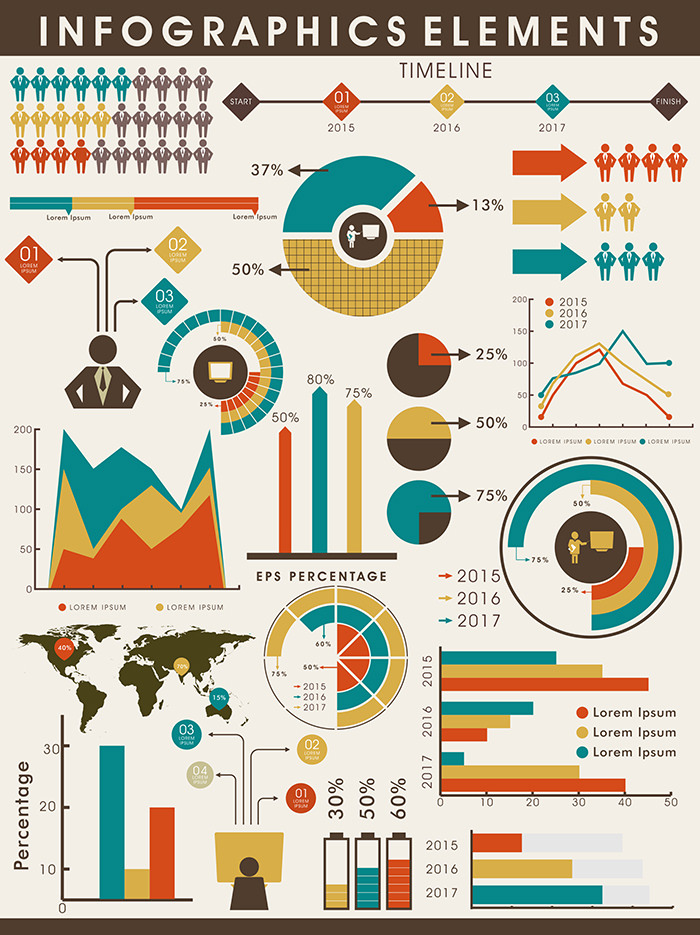
Download this infographic template
Example 3: Infographic templates set (10 templates)
The following is a full collection of various infographic templates targeted for various topics. You may use it as a template or as an inspiration to create your own.

Download 10 Free Infographics Templates
How to Promote your Infographic
- Optimize your infographic for search engines.
- Find websites and blogs that share similar infographics.
- Share infographics with the right bloggers and influencers.
- Submit your infographic to infographic directories.
- Promote through all your digital marketing channels.
Optimize for SEO
Infographics, even the finest infographic in the world, don’t become viral by chance.
The best way to quickly reach thousands of people with your infographic is to promote it carefully by contacting the relevant people and posting it on the correct websites.
But first, let’s talk about how to make your infographic search engine friendly. While search engine optimization (SEO) isn’t a guarantee that your infographic will go viral, it may certainly assist (which means more free traffic to your website).
share on blogs and website with similar infographics
To promote a new infographic on email marketing, for instance, I would head over to Google and enter the following query: “Email marketing infographic.” The infographics you need can be found on blogs and websites that publish works by other artists.
The next step is to do some email outreach to websites you believe may be willing to distribute your infographic after you have a solid list of them. The first step is to track out the original creators of each of the published infographics. The byline of an article is typically where you’ll find the name of the writer:
Having compiled a list of writers, you can next utilise an email address finder like Viola Norbert or ContentMarketer.io to begin sending out targeted messages.
Read this post by Brian Dean of Backlinko to find out how the experts do email outreach. The “Pre-Outreach” and “Content Roadshow” methods he employed to gain attention for his work are discussed in detail.
As an illustration, consider Emil’s 2-stage process for contacting people through email. In contrast to the standard 1-step strategy, he did not immediately request a backlink or share.
Not being aggressive has resulted in requests to share his work such as these (2-step method)
If you want more people to see your infographics, you need to do email outreach, which, I’ll be the first to say, isn’t the most thrilling component of infographic marketing.
As an added bonus, the connections you make with influential people and blogs will pay dividends in the long run.
Find the right bloggers and influencers
BuzzSumo is the finest tool for identifying these influencers. You can easily find the most shared articles on any given topic by simply searching for it or by pasting the URL of an external link.
If I were creating an infographic about gardening, for instance, I may enter “gardening infographic” into BuzzSumo to see what other people had created on the topic. The next thing I’d do is walk down the list of results and then click “View Sharers” on any infographics that look like mine.
When you do this, you’ll be presented with a list of the individuals who have shared that infographic, which you can then sort by number of followers to find influential users who have shared infographics like yours and have a significant number of followers.
Just as in the previous section, you need to track out their email address and begin individual correspondence. In addition to Viola Norbert and ContentMarketer.io, another ingenious method is to subscribe to the person’s blog; the welcome email and any subsequent emails from the blog should be sent from an address to which you may reply.
Sam Hurley, despite his massive following, took the time to comment to and share some of Brian Downard’s work.
To reach out to others, he used the same two-stage process as in the preceding email. He first inquired as to whether or not they were interested, and then followed up with a link to the video.
The key to obtaining answers and having your work spread is to not be aggressive. A courteous “thank you” email sent after an influencer promotes your material may also help build the relationship:
Use infographic directories for submission
Online directories like this collect and organise infographics for the benefit of the general public. And they are the best way for your infographic to be found by anyone who might want to embed it on their own site.
There are, however, a great many of these lists available; to save the hassle of personally compiling each one, I advise utilising Fivver to hire someone to do the work for you. Only hire someone who will submit your material to the top 10–30 infographic directories; there’s no need to have them submit it to more than 50.
Use all sort of digital marketing channels for promotion
After submitting your infographic to the appropriate repositories, you should distribute it using all of your marketing methods:
Email list sharing encouraged.
Put together a slew of social media
- Share with your email lists
- Schedule multiple social media posts
- Paid ads / remarketing ads
- Add links to infographic on relevant website pages
- Share with industry partners
- Send to influencers/bloggers who’ve shared your content in the past
- Share with any brand or person you mentioned in your content
To simplify communication with their target audience, marketers might benefit from using infographics. Think about whether an infographic may help convey your message the next time you’re brainstorming content.
Sell your infographics
You can sell your own made infographic templates or niche related infographics on platforms that allow selling digital products. To read more about these platforms read the following articles.
Best books about infographics
The following books talk in depth about how to create infographics and how to communicate data effectively with your audience. These books are extremely helpful for business professionals to present business data in presentations and pitches.


Thanks for the free infographic templates