Cool Infographics

Back To Shop

Cool Infographics

0 out of 5
  No Ratings
Categories: , , , ,
   9 Min   11:48 Min

Description

Product Thumbnail
Digithru
Cool Infographics
Loading
/

Power of Infographics in Visual Communication

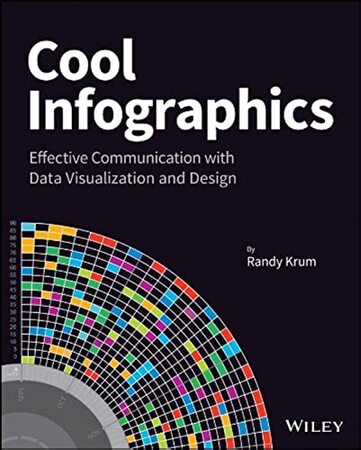
“Cool Infographics: Effective Communication with Data Visualization and Design” by Randy Krum is a comprehensive guide that explores the power of infographics as a visual communication tool. In this book, Krum takes readers on a journey through the world of infographics, showcasing their effectiveness in conveying complex information, engaging audiences, and telling compelling stories.

The book begins by introducing the concept of infographics and their evolution in the digital age. Krum highlights the importance of visual storytelling and how infographics can transform overwhelming data into digestible and visually appealing narratives. He emphasizes that infographics go beyond mere data representation and have the ability to evoke emotions and make information more memorable.

As the book progresses, Krum provides numerous examples and case studies that illustrate the diverse applications of infographics across various industries, from marketing and education to journalism and healthcare. He delves into the principles of good design, offering practical advice on selecting the right type of infographic for different purposes, using colors effectively, and ensuring clarity and accuracy. Additionally, the book addresses the technical aspects of creating infographics, including tools and software recommendations, as well as tips for optimizing them for online sharing and social media.

Krum also discusses the psychological impact of visuals and how they can influence perception and understanding. He explores the balance between aesthetic appeal and functionality, ensuring that infographics are not only beautiful but also informative and easy to comprehend.

By the end of the book, readers gain a thorough understanding of how to leverage the power of infographics to enhance their communication strategies, making complex information accessible and engaging for any audience.

Principles and Techniques of Effective Infographic Design

Randy Krum goes on to look into the key principles of effective infographic design, emphasizing the need for clarity, simplicity, and relevance. He discusses the importance of understanding the target audience, defining clear objectives, and choosing the appropriate data visualization techniques to convey the intended message. Krum provides valuable insights into the visual hierarchy, color schemes, typography, and layout techniques that contribute to impactful and visually stunning infographics.

Krum stresses that a successful infographic starts with a clear understanding of the audience’s needs and preferences. By defining the target demographic, designers can tailor their visual communication to ensure maximum engagement and comprehension. He underscores the necessity of setting clear objectives, which serve as a roadmap for selecting the right data and determining the most effective way to present it.

In his exploration of data visualization techniques, Krum covers a wide range of methods, from bar charts and line graphs to more complex visualizations like heat maps and network diagrams. He emphasizes the importance of choosing the right type of visualization based on the nature of the data and the message that needs to be conveyed.

Krum also delves into the technical aspects of design, offering practical advice on creating a strong visual hierarchy that guides the viewer’s eye through the infographic in a logical and intuitive manner. He explains how to use color schemes effectively to highlight key information and maintain visual harmony. Typography, another crucial element, is discussed in detail, with Krum providing tips on selecting fonts that enhance readability and complement the overall design.

Layout techniques are another focus area, with Krum explaining how to arrange elements on the page to create a balanced and aesthetically pleasing composition. He highlights the importance of white space in preventing clutter and ensuring that the infographic remains easy to read.

Throughout the book, Krum illustrates these principles with real-world examples and case studies, showing how effective design can transform complex data into compelling visual stories. By the end of the book, readers gain a comprehensive understanding of the principles and techniques needed to create infographics that are not only visually appealing but also highly informative and engaging.

Types of Infographics and Real-Life Examples

Randy Krum explores various types of infographics, providing a comprehensive overview of their unique features and applications. The book categorizes infographics into several types, including statistical infographics, informational infographics, timeline infographics, and comparison infographics. Each type serves a distinct purpose and is suited to different kinds of data and storytelling needs.

Krum examines real-life examples from different industries, showcasing the diverse ways in which infographics can be used to communicate information effectively. For instance, statistical infographics are often employed in business and marketing to present survey results, sales data, or market trends in a visually engaging manner. Informational infographics, on the other hand, are frequently used in educational settings to simplify complex concepts and enhance learning.

Timeline infographics are highlighted for their ability to present historical data or project milestones in a chronological order, making it easier for viewers to understand the progression of events over time. Comparison infographics are used to juxtapose different items, ideas, or concepts, helping audiences to quickly grasp similarities and differences.

Krum dissects the design elements of each example, pointing out the strengths and highlighting the key takeaways for readers. He emphasizes how effective use of color, typography, and layout can enhance the clarity and impact of an infographic. For instance, a well-designed statistical infographic might use contrasting colors to distinguish between different data sets, while a timeline infographic could utilize a clear, linear design to guide the viewer through the sequence of events.

Through detailed analysis, Krum provides readers with practical insights into what makes an infographic successful. He discusses common pitfalls to avoid, such as cluttered designs and misleading representations of data, and offers tips on how to optimize infographics for different platforms, including print and digital media.

By the end of the book, readers are equipped with a thorough understanding of the various types of infographics and how to apply design principles to create effective and visually compelling visualizations. Whether for business, education, or personal projects, the insights provided in “Cool Infographics” enable readers to harness the power of infographics to communicate their message clearly and memorably.

From Data to Storytelling: Creating Compelling Infographics

In this section Randy Krum goes beyond the design aspect of infographics and delves into the entire process of data gathering, analysis, and storytelling. He provides comprehensive guidance on finding reliable sources, conducting thorough research, and extracting meaningful insights from data. Krum emphasizes the importance of data accuracy and integrity in creating credible infographics and offers practical tips on avoiding common pitfalls and biases that can mislead viewers or distort the message.

Krum also addresses the critical role of technology in creating and sharing infographics. He explores various tools and software that facilitate infographic creation, highlighting their features, pros, and cons. Whether you are a novice or an experienced designer, Krum provides practical advice on selecting the right tools based on individual needs and skill levels. He covers popular software options such as Adobe Illustrator, Canva, and Tableau, detailing how each can be used to create professional-quality infographics.

A significant portion of the book is dedicated to the distribution and promotion of infographics. Krum discusses effective strategies for maximizing the reach and impact of infographics through various channels, including social media platforms, websites, blogs, and online communities. He emphasizes the importance of optimizing infographics for search engines to increase visibility and shares tips on how to drive engagement through compelling design and strategic placement.

Throughout the book, Krum emphasizes the importance of storytelling in infographics. He provides detailed guidance on crafting compelling narratives that resonate with the audience. This includes structuring information in a logical sequence and creating a visual flow that naturally guides readers through the infographic. Krum shares techniques for using headlines, captions, annotations, and call-to-action elements to enhance the storytelling aspect and keep the audience engaged. He illustrates how to balance data and narrative to create infographics that are not only informative but also captivating and memorable.

By the end of the book, readers gain a thorough understanding of the entire process of creating infographics, from initial data collection and analysis to the final stages of design and distribution. Krum’s insights equip readers with the skills needed to transform raw data into powerful visual stories that can communicate complex information in an accessible and engaging way. Whether for business presentations, educational materials, or marketing campaigns, the techniques outlined in “Cool Infographics” enable readers to leverage the full potential of infographics in their communication strategies.

The Future of Infographics and Evolving Trends in Data Visualization

The book concludes with a forward-looking section on the future of infographics and the evolving landscape of data visualization. Krum explores several emerging trends that are set to revolutionize how we create and interact with infographics. He delves into the rise of interactive infographics, which allow users to engage with data in a more dynamic and personalized manner. These interactive elements can include clickable charts, hover-over data points, and real-time updates, providing a richer and more immersive experience.

Krum also discusses the potential of virtual reality (VR) and augmented reality (AR) in the field of data visualization. He highlights how VR can create fully immersive environments where users can explore data in a three-dimensional space, while AR can overlay data visualizations onto the real world, enhancing understanding and engagement. These technologies open up new possibilities for storytelling, making data more accessible and engaging.

Additionally, Krum addresses the importance of staying current with technological advancements and the growing availability of sophisticated data visualization tools. He encourages readers to embrace innovation and adapt to new technologies to stay ahead in the field of infographics. This adaptability is crucial as the demand for more advanced and interactive forms of data visualization continues to grow.

In summary, “Cool Infographics” is a comprehensive and insightful guide that equips readers with the knowledge and tools to create effective and visually appealing infographics. Randy Krum’s expertise shines through as he navigates the principles, techniques, and best practices of infographic design. Whether readers are beginners looking to explore the world of infographics or seasoned professionals seeking to refine their skills, this book provides a valuable resource to enhance their ability to communicate through data visualization and design.

Krum’s exploration of the future trends ensures that readers are not only equipped with current best practices but are also prepared for the innovations that lie ahead. By the end of the book, readers are inspired to push the boundaries of traditional infographics, integrating new technologies and creative approaches to deliver powerful visual stories that resonate with their audiences. “Cool Infographics” ultimately serves as both a foundational guide and a forward-thinking manual for anyone looking to excel in the evolving world of data visualization.

Continue reading?
Already a member? Login